The passage of the Pension Protection Act (PPA) in 2006 opened the floodgates on automatic enrollment, with 59% of plans1 now offering the design feature. In addition, under SECURE 2.0 all newly established plans are required to offer auto-enrollment. The PPA created a safe harbor for plans to designate a qualified default investment alternative (QDIA), alleviating a key concern for ERISA Fiduciaries tied to investing participant assets where an affirmative election had not been provided. The PPA highlights four types of investment strategies as permissible choices for a QDIA: target retirement funds, lifecycle funds, static balanced funds, and professionally managed accounts. According to Vanguard, 98% of plans have turned to target retirement funds as the QDIA for auto-enrollment1.
Target retirement funds solve a simple problem – the ability and willingness to take equity risk isn’t the same for a participant at 25 as it is at 55. Tying age to risk tolerance has proven effective in approximating a reasonable asset allocation for most participants. That said, there is a building chorus in the asset management industry to take personalization in the QDIA a step further, recognizing that even among 55-year-olds, there is likely a wide range of risk tolerances that can’t be adequately addressed in a single target retirement vintage. This discussion has led to a proliferation of product development in professionally managed accounts.
How do managed accounts differ from target retirement dates?
Managed account solutions and target retirement funds take a dynamic approach to asset allocation, generally growing more conservative as a participant nears retirement. For target retirement funds, derisking is guided strictly by a participant’s age, whereas in most managed account solutions inputs can be widened to include gender, deferral percentage, account balance, and annual salary, each of which is available through the plan’s recordkeeper and requires no direct participant engagement. Participants may also build-in outside assets, projected wage growth, account balance goals, and itemized distributions in retirement. The more data a participant provides, the more tailored the asset allocation recommendation.
We strongly believe a personalized financial plan is the best path to retirement readiness for most plan participants. However, personalization via an automated managed account platform, without full consideration of the platform’s cost or net-of-fees performance, leaves plan sponsors potentially liable in fulfilling their ERISA fiduciary duty of prudence.
Cost
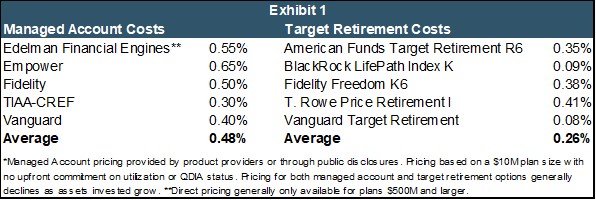
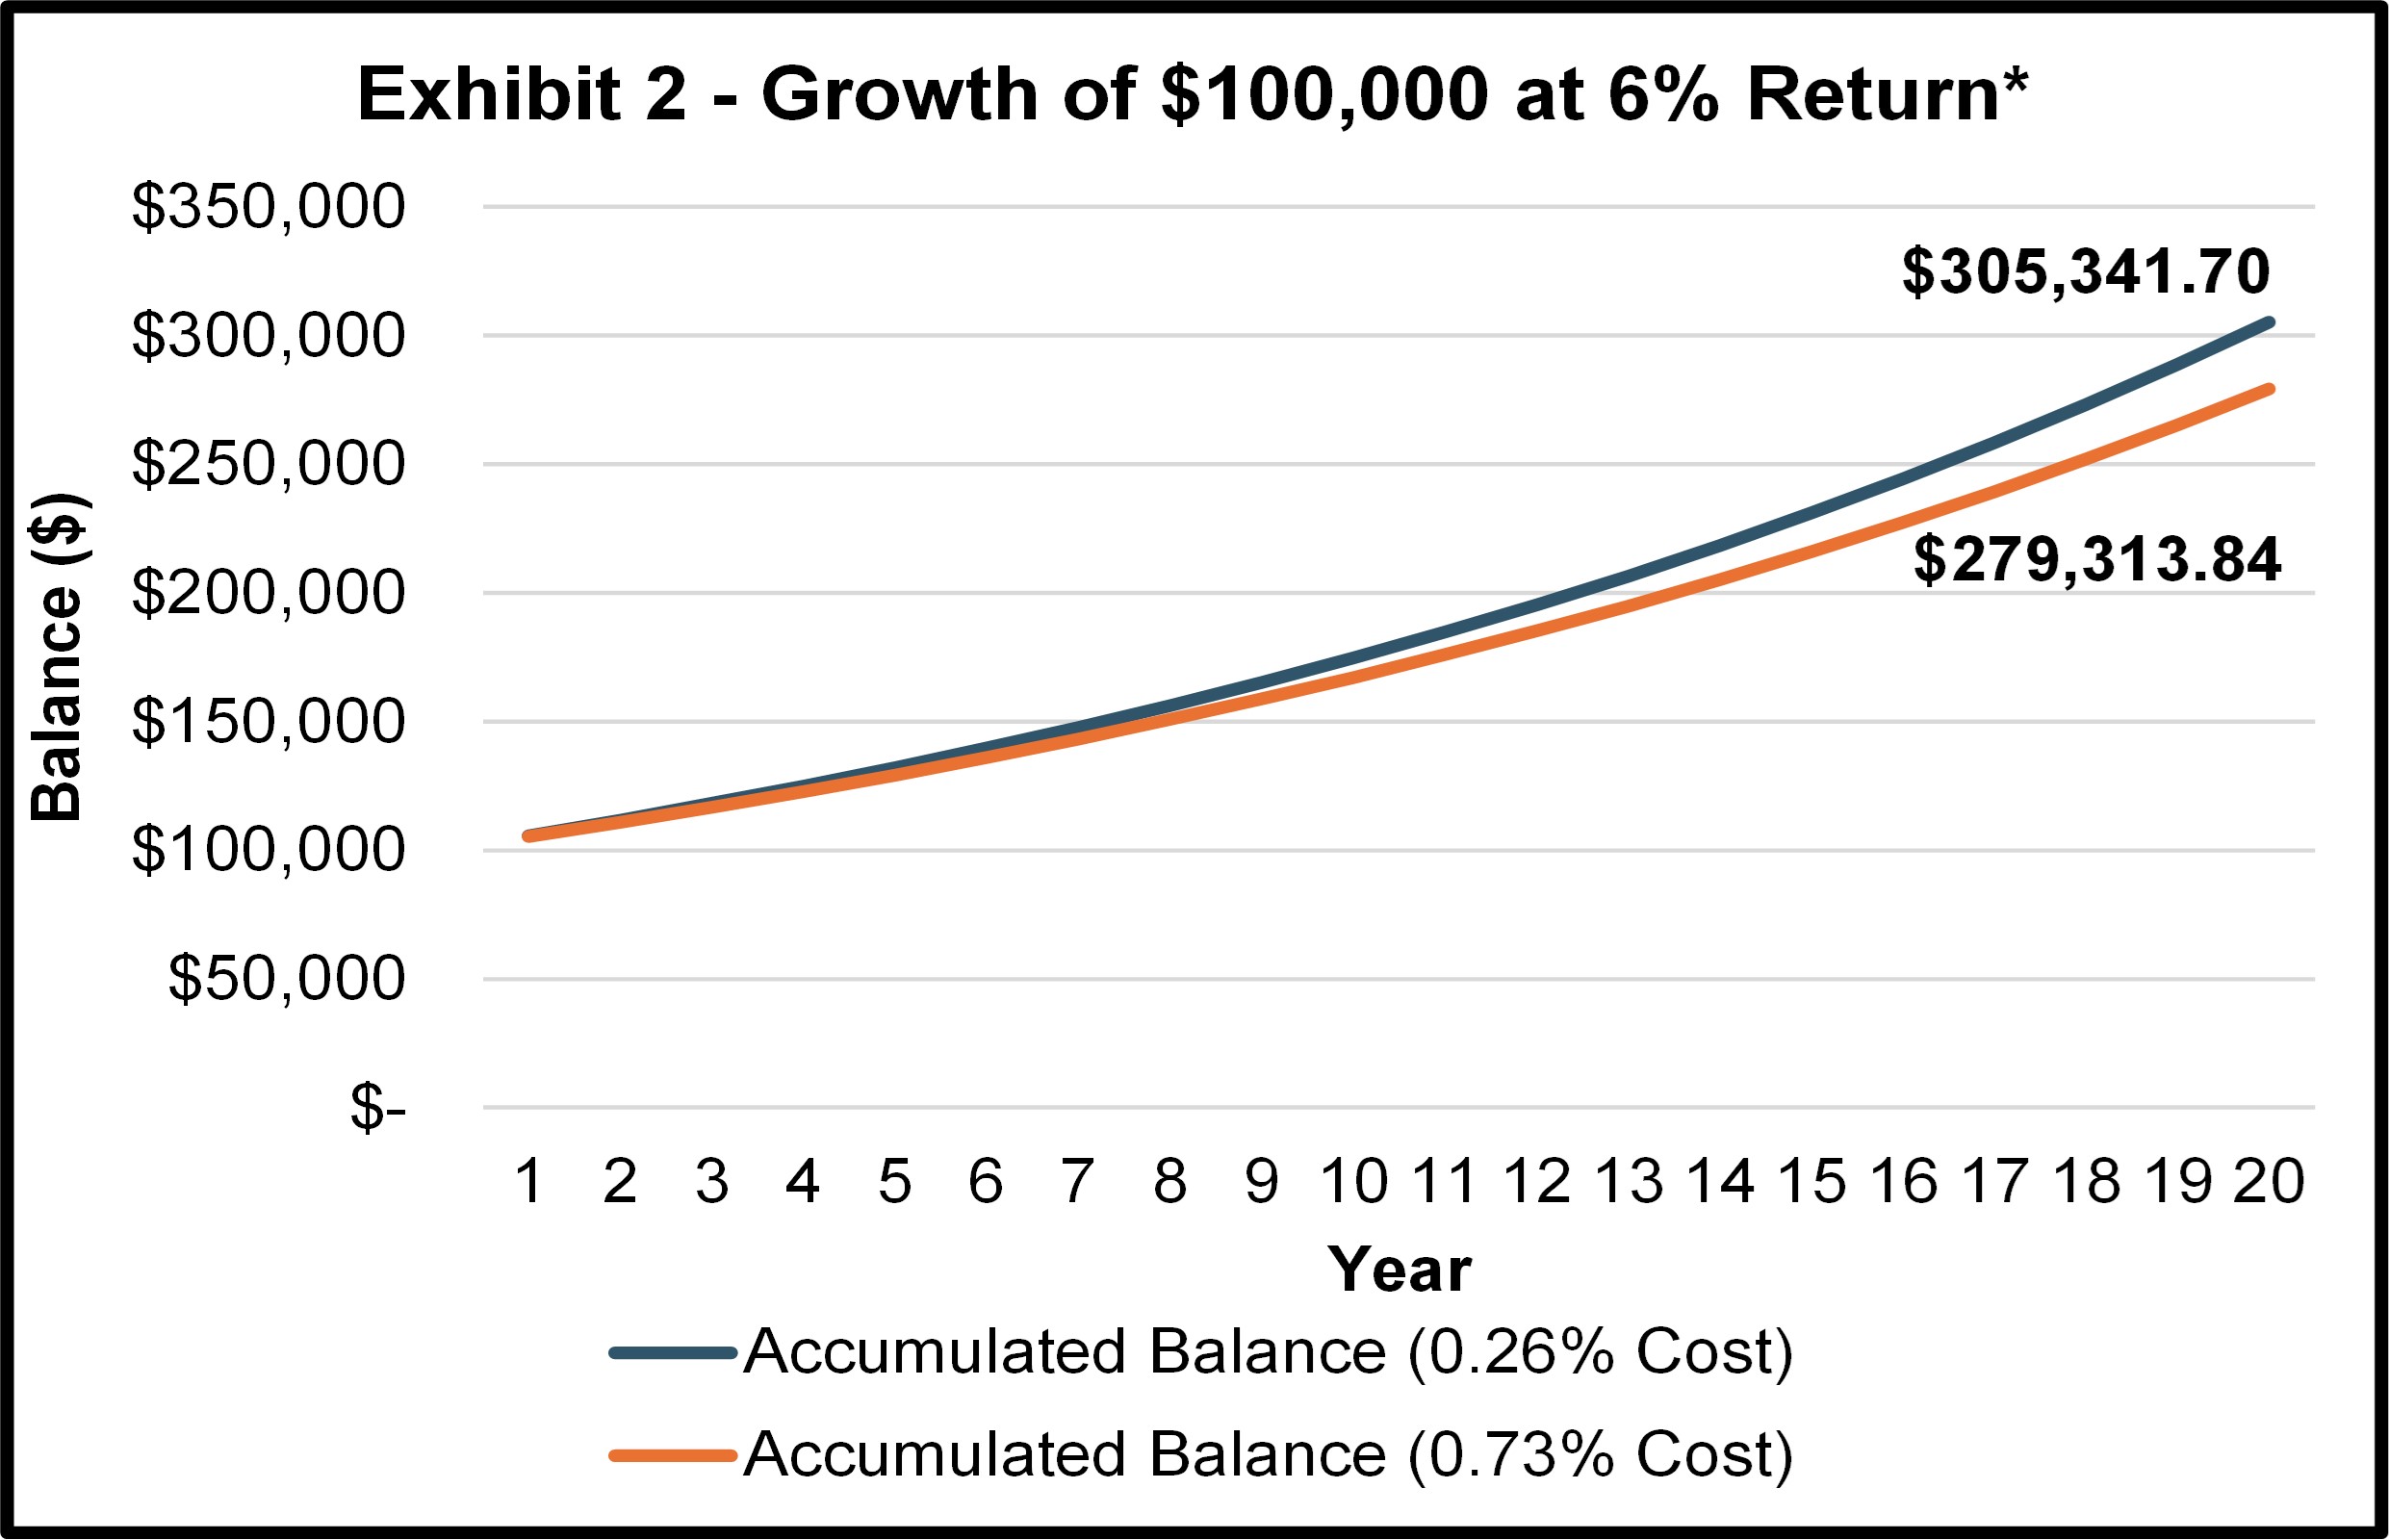
Trading scale for customization comes at a cost. While pricing for managed account services typically varies by plan size and utilization, the average cost of well-known programs is around 0.48% (Exhibit 1). This cost covers asset allocation but not underlying asset management, which depending on your plan’s total assets and core investment options likely adds another 0.25% to 0.50% of expense2. Taking the lower end of that range leaves you all-in annual costs of 0.73% Compare that cost to an average of 0.26% for the five largest target retirement providers and the fee differential is 0.47%. The cost drag of 0.47% on a $100,000 account earning 6% annually when compounded over 20-years is more than $26,000 (Exhibit 2).
Performance
With active management in any category, a higher cost investment strategy can be a prudent option for the plan, if on a net-of-fees basis the strategy generates performance that exceeds relevant benchmarks. The same holds true for managed accounts.
The individualized nature of these strategies can make performance appraisal difficult when viewed in aggregate. Many providers are unable to publish composite managed account returns for various levels of risk tolerance, claiming the “outcome-based” nature of the strategies makes monitoring aggregate performance irrelevant. However, as U.S. courts have ruled repeatedly, most recently in Hughes v. Northwestern University (2022), that ERISA’s duty to monitor extends to all investment options made available in the plan, including managed accounts.
If composite performance can be made available, we recommend segmenting performance by either age of participant or high-level equity allocation and comparing managed account results to those of corresponding target retirement funds. There is no standard methodology for performance reporting, and where managed account performance has been made available to Francis, results relative to the top performing target retirement strategies have been mixed.
Evolving Landscape
While the push toward a more personalized retirement planning experience is positioned as a distinct positive, we believe further cost concessions and a dramatic increase in performance transparency are necessary to make most managed account platforms viable solutions within ERISA-governed plans. Improvements on both fronts will be particularly important if managed accounts are to be seriously considered as a plan’s QDIA.
Investment in managed account product development among asset managers has been substantial. Just as target retirement strategies have evolved and improved over time, we expect the same for managed accounts. While managed accounts haven’t experienced much uptake as QDIAs, utilization has grown for plans offering the solution on an opt-in basis. As of year-end 2023, 7% of participants on Vanguard’s recordkeeping platform enrolled in a managed account service up from 3% in 20131.
To the extent plan sponsors are considering evaluating a managed account solution, we recommend conducting in-depth due diligence on the strategy at all levels, including, but not limited to:
- Net-of-fees performance (actual, not hypothetical)
- Cost of various levels of investment
- Asset allocation methodology
- Quality of management and associated resources
- Quality of underlying investments (if different than the plan’s core menu options)
- Participants data collected from recordkeeping partner
- Opportunities for participants to disclose additional information
Sources:
1Vanguard, How America Saves 2024
2PLANSPONSOR 2021 DC Plan Benchmarking Survey. National average plans between $10M and $50M in assets.