

Written By: Ed McIlveen, CFA, Chief Investment Officer at Francis LLC
EXECUTIVE SUMMARY
Divided government is the most widely forecasted outcome for the next Congress, and markets have historically done well with it. The items worth watching are the fiscal deadlines of 2027, not party labels. The “Bipartisan Investor” who does not base their trades on political wins or disappointments has the best chance for success.
Introduction
Two years ago, in our October 2024 edition, we closed a discussion of presidential election cycles with a homework assignment: “Set your reminders to look for opportunities in October and early November 2026.”1 Consider this your reminder going off.
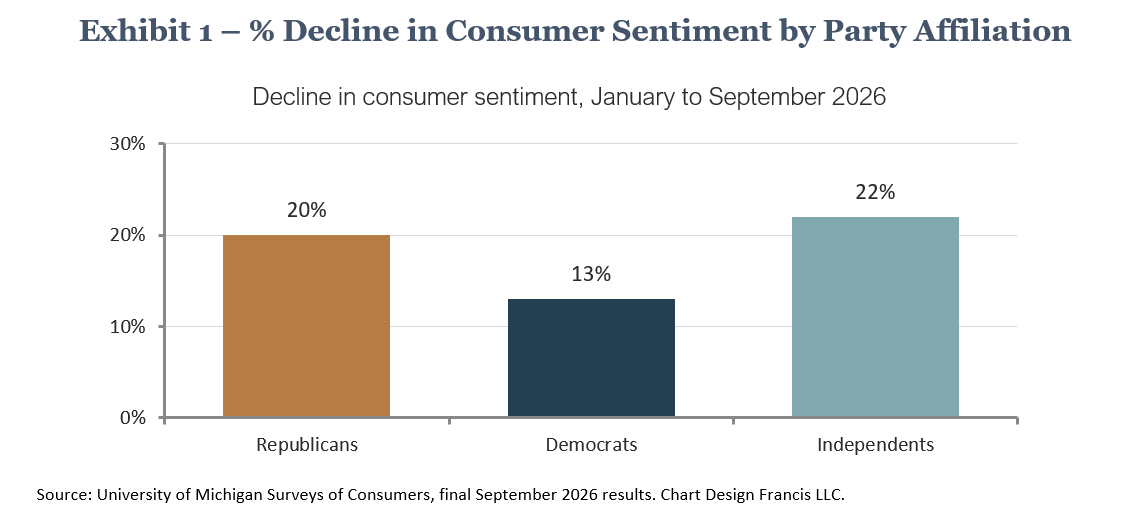
The mood as the alarm sounds is not a cheerful one. The University of Michigan’s Index of Consumer Sentiment fell to 48.1 in September, only a few points above the all-time low of 44.8 recorded in May.2 In past election seasons, sentiment has split neatly along party lines, with one side of the aisle confident and the other despondent. This year, pessimism seems to be creeping in no matter what your political persuasion. Since January, sentiment is down 20% among Republicans, 13% among Democrats, and 22% among Independents (see Exhibit 1).2 It turns out the one thing Americans have in common is that they are increasingly wary of their personal financial circumstances.
And yet, as of mid-October, the S&P 500 Index was up nearly 13% for the year and sitting within about 1% of its all-time high.3 That gap between how investors feel and how their portfolios have actually performed is the kind of disconnect that leads to hazardous decisions with money. Layer a contentious election on top, and it does not take much to convince an already uneasy investor that the market is one bad headline away from collapse, which is exactly the moment to resist the temptation to time the market by moving your money to safety.
This analysis picks up where our 2024 piece left off. We begin by revisiting the history of midterm election years, compare that history against what happened in 2026, and then consider what a new Congress can and cannot change for investors. As before, we recommend you approach all of this from the viewpoint of the “Bipartisan Investor,” meaning that regardless of election outcomes, you should stick to your long-term investment strategy.
Understanding History
In 2024, we described the four-year presidential cycle and noted that Year 2, the midterm year, has on average been the weakest and most volatile of the four. The data supports the reputation. From 1930 through 2022, the S&P 500 averaged a return of 4.7% in midterm years compared to 9.5% in all other years.4 The ride has been bumpier as well, as the median midterm year since 1950 has included a peak-to-trough decline of 16%.3
The volatile political pattern is also a reminder of how fluid the democratic process is. Victories won along party lines in one election season rarely repeat in the next. In fact, over the past 23 midterm elections, the president’s party has lost an average of 27 seats in the House of Representatives and three in the Senate. In contrast, the party holding the White House has gained seats in both chambers only twice.4 In other words, the mandate a party celebrates one November is often substantially revised by voters just two years later, and whatever feels permanent about today’s political landscape undergoes a referendum in short order.
How Does 2026 Compare So Far?
Here is where the story gets interesting. Year two of a presidential cycle is typically lackluster, but the S&P 500 has ignored the averages and charged ahead to record highs. The year’s largest decline, roughly 9% ending in late March, fell well short of the 18% drawdown typical of a midterm election year.3
About That Reminder
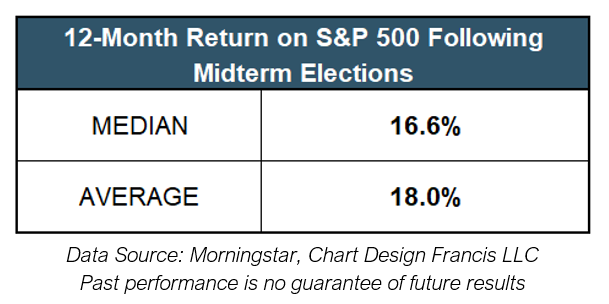
The S&P 500 has been higher 12 months after every midterm election since 1946, with an average gain of 18.0%. See Exhibit 2. But it is worth asking why. Midterm years have often included a deep decline, which means Election Day has frequently arrived near a low. Measured from the midterm-year low, the average gain over the following year is about 30%.3 Much of the famous post-midterm rally, then, has been a rebound.
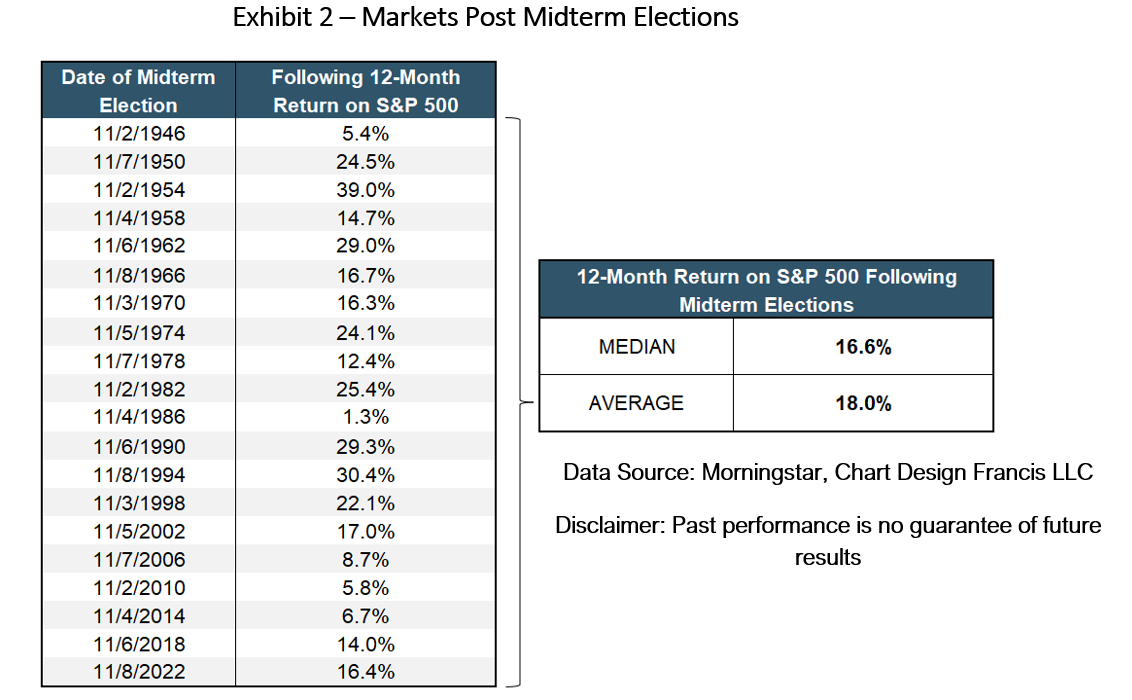
This year there has been little to rebound from. That does not make the months ahead any less promising, as nothing about a strong year prevents another one. It does mean that investors expecting history to repeat with the average high double-digit return are leaning on a pattern whose usual setup is missing. As we wrote in 2024, this could be one of those statistics that is true until it is not.
Beware of Your Biases
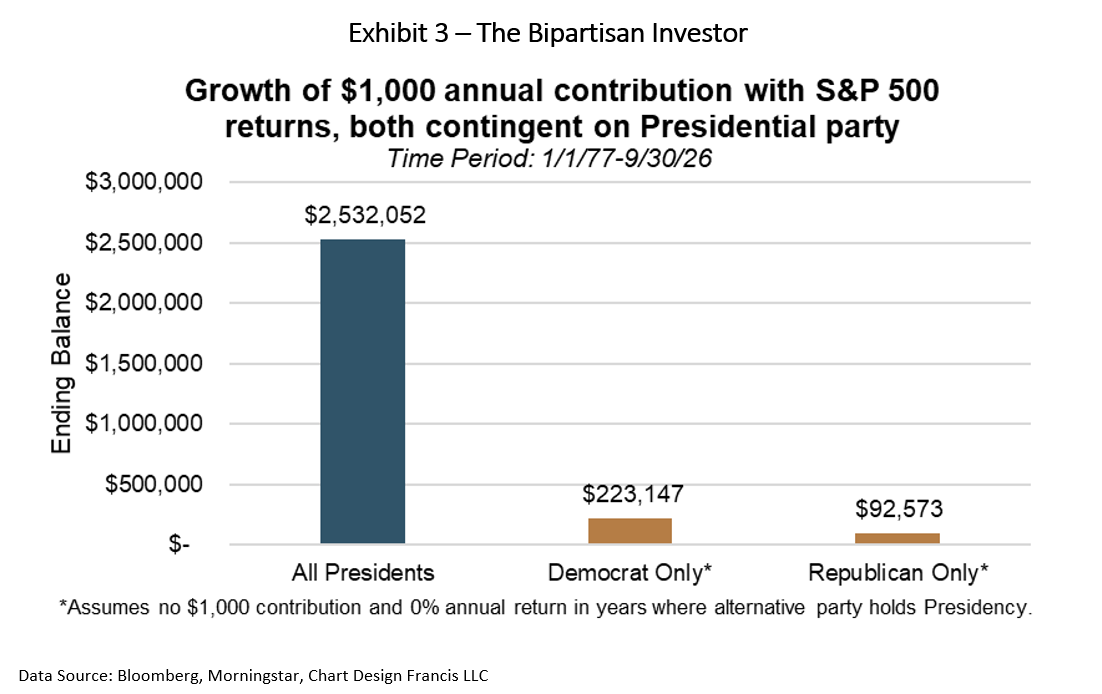
Nevertheless, in our 2024 edition we highlighted the “Bipartisan Investor,” the investor who stays in the market regardless of which party occupies the White House. As Exhibit 3 shows, that has been the most profitable path forward for nearly 50 years. The same discipline applies to Congress.
The temptation in a midterm year takes a slightly different form. Rather than asking, “What if my candidate loses…”, investors ask “What happens to my portfolio if the House or Senate changes hands?” The honest answer is that changes in control are the norm and not the exception. Since 2000, only two federal elections, 2004 and 2012, failed to change party control of the House, the Senate, or the White House.6 Markets have compounded through all of it.
There is also a practical problem with trading on the outcome: it is rarely a surprise. The president’s party has lost House seats in all but two midterms since World War II,7,8 so a result that follows the pattern is one that markets have had ample time to consider. Selling can potentially be an expensive way to express a political opinion. As we noted in 2024, framing and anchoring can distort investment decisions, and that risk is no smaller when the political spotlight moves from the executive branch to the legislative one.
Divided Government Still Pays Dividends
As this edition goes to print, the most widely forecast outcome is for a divided government, with Democrats favored to take the House and possibly the Senate.6 Forecasts are not results, and we caution against treating any prediction as settled. Regardless of the outcome, it is worth noting that from 1933 to 2023, when either a Democrat or a Republican held the presidency and worked with a divided Congress, the S&P 500 has returned nearly 14% per year on average. Political gridlock, it turns out, has rarely been bad for investors.9
Understanding Fundamentals
As we wrote in 2024, corporate profits, interest rates, inflation, and economic growth are the key drivers of stock prices regardless of the election cycle, and they transpire over years rather than news cycles.
Consider what investors absorbed this year. The Supreme Court reshaped the tariff landscape.10 A Middle East conflict erupted in the first quarter and coincided with the market’s low for the year.11 The Federal Reserve changed leadership in May, with Kevin Warsh succeeding Jerome Powell as chair.11 Any one of these would have been a reasonable excuse to move to the sidelines. An investor who did so would have missed a market that went on to set new highs.
Meanwhile, the multi-year investment in artificial intelligence infrastructure, the kind of technological revolution we referenced two years ago, continued to command more of investors’ attention than anything on the campaign trail.
Where politics does show up is beneath the surface. Rather than a materially different outcome for the market as a whole, the more credible effect of a change in Congress is greater dispersion between sectors, as oversight and scrutiny shift toward politically sensitive industries such as energy, healthcare, and technology.8 For an investor, that is an argument for staying diversified. Owning the whole market means you do not have to guess which industry ends up in front of a congressional committee.
Finally, recall that investor sentiment is often a contrarian indicator. With sentiment near record lows in aggregate and stocks near record highs, the lesson of 2026 so far is that feeling bad about the economy and doing well in the market are not mutually exclusive.
Understanding Issues Politically
With fundamentals as the bedrock, it is worth noting where a new Congress could matter. In 2024, we focused on tax policy, fiscal policy, and federal regulations as the areas most impacted by presidential politics. For a midterm, the list is shorter, because Congress acting alone changes less than a campaign season suggests.
Fiscal policy is one area to watch. Funding deadlines and the debt ceiling will require Congress to act. Deficits were forecast to be large under either presidential candidate in 2024, and nothing about the midterms is likely to change that trajectory. The mounting concerns about the U.S. government’s desire to spend more than it takes in is likely to keep some upward pressure on interest rates in the near term.
For our readers who sponsor or participate in retirement plans, there is a more encouraging angle. Retirement policy has been one of the few reliably bipartisan areas in Washington. As one industry advocate put it earlier this year, “If there is a desire to get anything done in 2027 and 2028, retirement policy is going to be it.”12 Proposals already in circulation address expanding access to workplace plans, allowing 403(b) plans to invest in collective investment trusts, and reforming ERISA litigation.12
Whether any of this advances depends less on which party wins than on who leads the four committees with jurisdiction over retirement plans: House Ways and Means, Senate Finance, House Education and Workforce, and Senate Health, Education, Labor, and Pensions.13 Committee assignments will be settled in the weeks after the election.
Understanding Investment Strategy
Strategic thinking should still prevail. In 2024, we closed with a question. Is there a case for a tactical tilt to stocks going into the pre-election year? Two years later, with Year 3 of the cycle about to begin, our answer is more modest than the statistic might suggest.
History remains on the side of risk assets in the year following a midterm election, and we would not argue with a record that has held since 1946. That record is a reason to remain invested. But it rests on only 20 observations, and the deep midterm-year decline that usually sets up the rebound did not occur this time, so it is not a reason to reach for more risk than your plan already calls for.
So, what should you do? First, rebalance if you are nearing retirement. After a year in which stocks have gained double digits, some portfolios hold more equity than intended, and trimming back to target when bonds have some of the best yields in years is sensible. Second, keep contributing. Regular savings do more for long term outcomes than any election result. Third, if you are invested in a target date fund or a professionally managed portfolio, recognize that this work is already being done on your behalf, without regard to anyone’s party registration.
As You Head to the Polls…
In 2024 we compared the simple, reliable approach of staying invested, diversifying, and saving regularly to generic medicine: steady, effective, and battle-tested. The prescription has not changed, and 2026 has been a fine demonstration of why. The year that history said could be the weakest of the presidential cycle has so far turned out to be a strong one, in spite of war, tariffs, a change at the Fed, and an electorate in a sour mood.
By all means, vote. Then leave your portfolio out of it. Whatever the makeup of the next Congress, the investors most likely to be rewarded are the ones who are still invested, still diversified, and still saving in the years that follow.
Francis LLC is a Registered Investment Adviser with the SEC. Past performance is no guarantee of future results. Any reference to individual stocks, securities, or companies is not intended as investment advice and could be owned individually or in personal and family portfolios by members of the firm. We have no affiliation with and receive no remuneration from any firm, product, or service provider mentioned in this publication. This paper is for informational and educational purposes only and does not constitute investment, legal, or fiduciary advice; plan fiduciaries should consult qualified counsel and investment professionals before acting on any framework described here.
Sources:
1 Investor’s Outlook, October 2024, “From Campaigns to Capital Gains: Handling Your Portfolio During Election Season,” Francis LLC.
2 University of Michigan Surveys of Consumers, final September 2026 results, as summarized by TheStreet Pro, September 25, 2026. https://pro.thestreet.com/market-commentary/one-thing-republicans-and-democrats-agree-on-the-economic-outlook-has-declined.
3 Information provided by Bloomberg as of 10/16/26.
4 Capital Group, “How US midterm elections affect the markets,” January 26, 2026. https://www.capitalgroup.com/institutions/global-consultants/en/insights/articles/how-us-midterm-elections-affect-the-markets.html.
5 Bank of America, citing Bloomberg data, as reported by investingLive, October 6, 2026. https://investinglive.com/stock-market-update/s-p-500-defies-midterm-slump-as-bank-of-america-says-history-favours-post-election-gains/.
6 State Street Investment Management, “US Midterms: Limited Change Now, Greater Policy Risks Ahead,” Elliot Hentov, September 14, 2026. https://www.ssga.com/us/en/institutional/insights/us-midterms-limited-change-now-greater-policy-risks-ahead.
7 BlackRock, “What history says about 2026 midterm elections and market performance,” October 1, 2026. https://www.blackrock.com/us/financial-professionals/insights/2026-midterm-elections-and-market-performance.
8 Schroders, George Brown, as reported by Trustnet, September 23, 2026. https://www.trustnet.com/news/13484690/what-the-us-midterms-mean-for-investment-portfolios.
9 Fidelity, Strategas Research Partners. https://institutional.fidelity.com/app/item/RD_9908222/the-election-and-markets-5-takeaways.html, 2026.
10 Morgan Stanley Wealth Management, “7 Political Trends Investors Should Watch in 2026,” March 17, 2026. https://morganstanley.com/insights/articles/investor-guide-political-trends-2026.
11 Sequoia Financial Group, “The Midterm Year Roadmap: What History Tells Us About 2026,” June 4, 2026. https://www.sequoia-financial.com/insights/the-midterm-year-roadmap-what-history-tells-us-about-2026/.
12 American Retirement Association Washington Update, Josh Oppenheimer, as reported by PSCA, February 5, 2026. https://www.psca.org/news/psca-news/2026/2/an-insiders-look-at-2026-retirement-policy/.
13 J.P. Morgan Asset Management, Retirement Insights, September 29, 2026. https://am.jpmorgan.com/us/en/asset-management/adv/insights/retirement-insights/leg-reg-2026-q4-committees-midterms-retirement-policy/.
