

Written By: Ed McIlveen, CFA, Chief Investment Officer at Francis LLC
EXECUTIVE SUMMARY
Owning “the market” in 2026 means navigating a landscape defined by semiconductor chip-driven concentration at the top of major indexes, rapid inclusion of mega-cap IPOs such as SpaceX, and the risk of disciplined active managers who may run out of runway before their views are validated. In this paper, we explore how index construction has changed and what that means for plan fiduciaries.
Setting the Table
Somewhere in America, a plan participant checking her 401(k) balance believes she owns “the market.” In her mind, an index fund is the neutral, diversified default. In practice, she owns whatever a group of elite committees at S&P Dow Jones Indices, MSCI, FTSE Russell, Nasdaq, and CRSP have decided the market should look like.
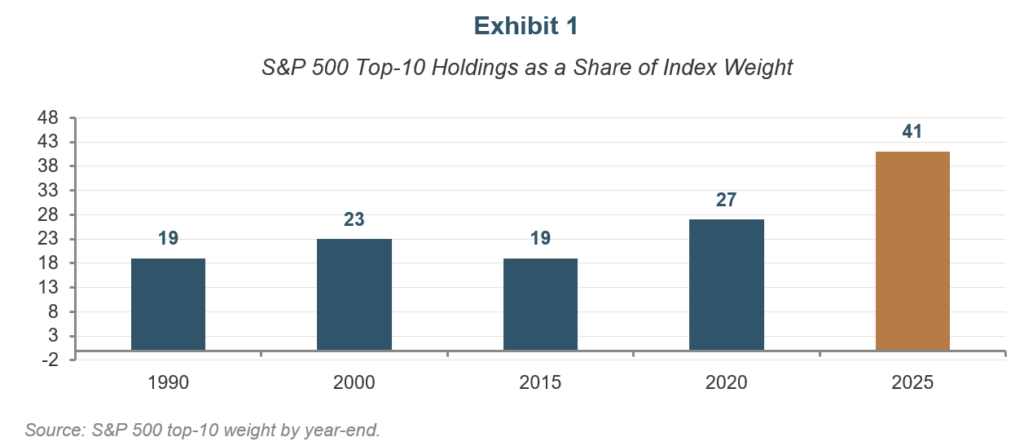
The disparities between index providers used to be a technical footnote and never a concern by the masses. Yet, by the end of 2025, the ten largest companies in the S&P 500 accounted for roughly 41% of the index’s total weight, more than double their share just a decade earlier.1 A handful of names including NVIDIA, Microsoft, Apple, and, even in emerging-market benchmarks, Taiwan Semiconductor, can move indexes more than nearly all other constituents combined. Regardless of how we got here, such concentration is a substantial concern for anyone seeking to build a diversified portfolio.
When Elon Musk’s aerospace and AI company, SpaceX, completed the largest initial public offering in history on June 12, 2026, raising roughly $75 billion at a valuation near $1.75 trillion, it highlighted how index providers treat mega-cap newcomers.2 Nasdaq fast-tracked the company into the Nasdaq-100 within 15 trading days. FTSE Russell and CRSP built five-day fast-entry windows. However, S&P Dow Jones Indices declined to waive its profitability requirement for a company reporting a $4.3 billion quarterly loss.
Call it a recipe, if you like. Every “market” index is built from a small number of ingredients which includes a market-cap formula, a profitability screen, and a float rule mixed to serve to tens of millions of retirement savers as “the market.” Change the recipe even slightly, as SpaceX’s listing caused several providers to do, and the flavor of what investors own changes with it.
With these differences and the disparity in outcomes, it’s clear that index selection should be considered an active decision. Is “the market” any publicly traded company weighted purely by size? And, what about active managers underweighting the momentum drivers in the indexes? Will their businesses perish or survive until the day when they may prove their stock selection decisions were accurate?
What’s Really in “the Market”
Market-capitalization is widely assumed the predominant reason to include a stock in an index. It is, of course, one aspect among several, chosen for low turnover, easy replication, and minimal trading costs. Traditionally, this has been a defensible way to represent an investable market.
However, every major index provider layers its own eligibility screen on top of that convention: required float, sector classification, required liquidity thresholds, and, in S&P’s case, a profitability test that has existed for decades. Tesla sat outside the S&P 500 for years despite enormous market value, until it finally posted four consecutive profitable quarters in 2020.4
Even the largest providers do not fully agree on what belongs in a “core” index versus a specialty one. MSCI applies its own market-accessibility and size screens. Russell reshuffles index membership once a year based on a May snapshot. None of these frameworks is inherently wrong per se as they weigh different judgments about what “investable” and “representative” mean. The rules were never identical across providers, and the nuances fell into realms that only financial nerds and academics found reason to examine. This stopped being minor as SpaceX can qualify for one benchmark family within five trading days but be barred, perhaps indefinitely, from another.
The Chips Are Stacked
The scale of today’s concentration is disconcerting. In 1990, the ten largest companies in the S&P 500 made up about 19% of the index, spanning industrials, oil, and consumer staples. By 2015, top-10 concentration was still around 19%. In the decade since, that number has more than doubled (Exhibit 1).
The market value of some of these companies is something to behold. By early 2026, the ten largest U.S. companies carried a combined market value of roughly $25 trillion which is larger than every stock market outside the United States combined. In the case of the S&P 500, a handful of, albeit gargantuan, balance sheets are paired with 490-some smaller companies that struggle to move the needle either in terms of total return or earnings growth versus the top-ten.
Because index funds allocate so much of the new money invested in them into these largest names, flows into index funds drive these names disproportionately higher, boosting index funds’ performance and attracting an ever-increasing flow of capital. It’s a reflexive loop that gets rewarded as times are good, but this same process, upon a turn in sentiment, drives these largest names disproportionately lower.
A related, but distinct point to be made, shows up outside U.S. large-cap benchmarks. In MSCI’s emerging-markets index, Taiwan Semiconductor has grown into one of the largest single-company exposures that emerging markets investors carry. Here, a combination of concentration and country classification of South Korea has driven a remarkable divergence between Fidelity’s and Vanguard’s emerging‑markets index fund offerings: Fidelity’s index fund (ticker FEMKX), tied to MSCI, which includes Korea, delivered a 12-month gain of 45.4% as of 6/30/26, while Vanguard’s FTSE‑based product (ticker VWO), which omits Korea, earned just 23.8%. Fiduciaries and investors need to understand index methodology and country classifications, rather than assuming all passive benchmarks are interchangeable for an asset class.
Adding Rocket Fuel to the Recipe
If concentration describes what happens after a company is already in an index, the SpaceX case shows how differently providers decide who gets in — and how fast (Exhibit 2).
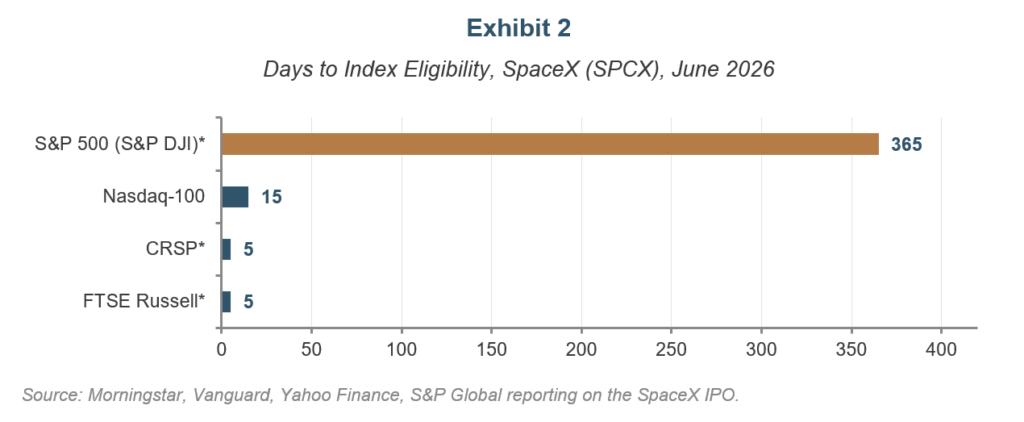
FTSE Russell and CRSP built five-day fast-entry rules for offerings of SpaceX’s size, and it’s believed these changes could be applied to other AI-themed IPOs in the future. Nasdaq admitted the company to the Nasdaq-100 within 15 trading days. S&P Dow Jones Indices publicly declined to bend its financial-viability screen, so SpaceX remains excluded from the flagship S&P 500 until it demonstrates sustained profitability.
The practical consequence: two investors holding what they believe are functionally similar “total market” funds can end up with meaningfully different exposure to the same company, purely depending on which provider’s rulebook their fund happens to follow.
Expect this to reoccur. Index research desks have already flagged that the same fast-entry questions raised by SpaceX could apply to the next wave of massive, long-private companies eyeing public markets, including other large AI-focused firms. Each new case will force the same choice on providers, one listing at a time — and each choice reshapes what is “the market.”
“The Market”
All of this forces a question index providers have answered in genuinely different ways: should index membership require evidence of financial viability, or should any sufficiently large public company qualify on market capitalization alone?
The case for a profitability screen is straightforward: it protects the integrity of a “core” benchmark that tens of millions of retirement savers use as a default holding. The case against a strict screen is also equally coherent: excluding the largest, most economically significant new companies from a “total market” index arguably makes that index less representative of the overall U.S. economy. Index providers themselves are split on this question, which is precisely why the choice of index has become an active one.
Some industry titans have concluded it is acceptable to include scores of companies with no profits. Roughly 40% of Russell 2000 companies currently carry negative trailing earnings, 14% in the Russell Midcap Index and 3% of the Russell 1000 constituents won’t earn a profit in the near-term either.
Different index providers have developed proprietary methods for replicating the investable U.S. economy. Keep in mind, the significant growth in private equity over the last 25 years, in combination with a sharp decline in publicly traded stocks, limits the ability of any index to be representative of the overall U.S. economy. Within the confines of the public markets, the index providers are optimizing different characteristics, but a fiduciary who assumes all index funds represent an asset class equally runs the risk of being surprised, as the emerging markets example earlier illustrated.
The Diversified Dish Disappoints
Recently, most active managers have avoided concentrating into the largest technology and AI-related names based on valuation discipline or diversification grounds. So long as the market rewards those themes, many managers have underperformed benchmarks that mechanically ride that concentration higher.
In 2015, the S&P 500’s top-10 holdings’ share of index weight and its share of index earnings were nearly identical. By 2025, that alignment had broken down: the top 10 held roughly 41% of index weight but generated an estimated 32% of index earnings (Exhibit 3).3
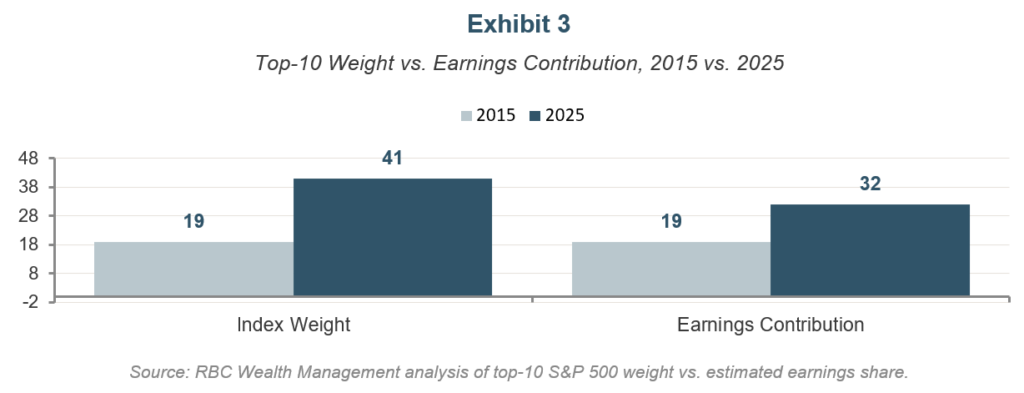
But there is a second, sharper edge to this story, and it belongs to the managers themselves, not just their shareholders. Refusing to hold a concentrated portfolio is a real decision with an opportunity cost which accrues every quarter the concentration in the index persists, whether the underlying discipline is eventually rewarded.
When the Market Runs the Kitchen
There is an old line about markets that gets repeated often precisely because it keeps being true: markets can stay irrational longer than an investor can stay solvent. The saying is often attributed to John Maynard Keynes, though the attribution is disputed; what is not disputed is how often it applies to active managers who resist a concentrated market on valuation grounds. The price they and their investors pay comes in the form of underperformance versus index funds in runaway bull markets.
According to S&P Dow Jones Indices’ SPIVA U.S. Scorecard, 79% of all active large-cap U.S. equity funds underperformed the S&P 500 in 2025, which was worse than 2024’s 65% rate, and the fourth-worst year in the scorecard’s 25-year history (Exhibit 4). Over rolling 15-year periods, roughly 90% of active large-cap funds lagged the index.5 Being a disciplined holdout from mega-cap concentration has been, on average, an expensive place to stand. Active U.S. equity funds saw meaningful net outflows in 2024 even as roughly $1.7 trillion flowed into passive vehicles. 6
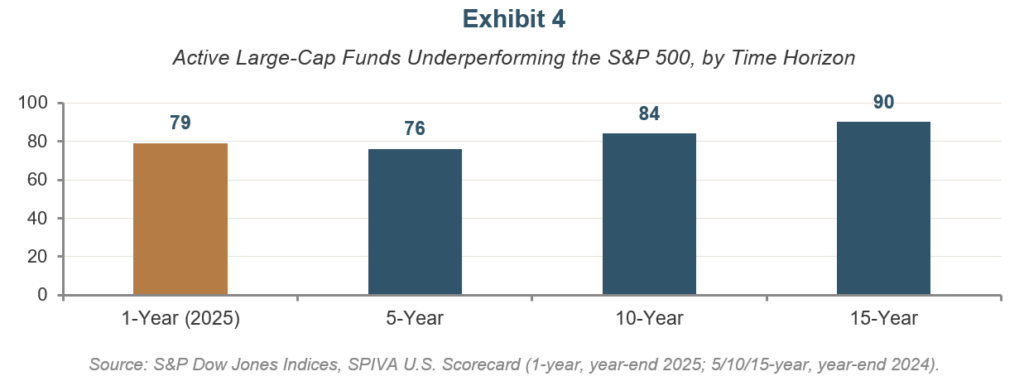
That underperformance is not merely uncomfortable; it is a business risk for the manager and a potential career risk for the people running those funds. History offers a vivid example from over 25 years ago. Julian Robertson’s Tiger Management, one of the most respected hedge funds of its era, closed in March 2000 after Robertson refused to chase stocks with valuations that he considered indefensible in the era’s most popular technology names. The NASDAQ peaked and began its collapse within days of that decision, vindicating the discipline almost immediately, but only after the fund itself, and the investors who had already redeemed in frustration, were no longer around to see the relative benefits.
The setup today has some echoes to that time frame even if the details differ. Active portfolios remain, on average, about seven to nine percentage points underweight technology relative to the S&P 500’s own weighting, even though many of these managers say they are bullish on the sector and can see the benefits of AI filtering down into other areas of the economy.7 SPIVA’s own survivorship data shows why patience has limits: over 15-to-20-year windows, half of all active funds have been shut down or merged into other funds, typically because chronic underperformance led sponsors to close them.
None of this proves today’s concentration will unwind the way the dot-com bubble did, or that it won’t. The point of this section is not to predict when the next rollover happens. To this end, we are often asked by clients when the current bull market and the AI-themed stock frenzy collapses. The reality is, nobody knows, but familiar signs include a large debt build-up, rapid upward changes in interest rates, and sky-high consumer confidence. Of the three signposts, the build-up in corporate debt is increasingly evident, while the others are not aligned with historical pre-crash measures.
Reading the Label
For retirement plan sponsors and committees, this is not an abstract debate. ERISA’s duty of prudence requires fiduciaries to select and monitor investment options through a reasoned, documented process — it does not automatically bless “we indexed it” as an ample solution.
If two index funds tracking supposedly similar asset classes carry meaningfully different concentration and inclusion characteristics, then the choice of benchmark, and the provider behind it, arguably falls within a fiduciary’s duty to understand what is offered to participants.
The same label-reading applies on the active side. A manager’s stated discipline is only part of the picture; the other part is how much redemption pressure, career risk, or business risk sits behind that discipline, and whether it can survive long enough to matter when market forces continue to batter their discipline.
Ultimately, we find that investors benefit from owning both passive and active strategies with time being the main factor to consider when one strategy outperforms another.
Clearing the Table
Index investing has earned its place as a low-cost, effective core holding for retirement savers. But “the market” has a set of competing definitions written by the index committees, and the events surrounding SpaceX’s 2026 IPO remind us of this fact. The same concentration that raises fiduciary questions about passive benchmarks also raises some solvency questions for the active managers standing against it — questions that should be considered alongside performance and fees.
Plan sponsors, advisors, and committees should treat both benchmark selection and manager selection as governed decisions, which are well-documented. Attending to a process that is disciplined does not guarantee a better outcome for someone’s nest egg, but it will be prudent in guiding anyone through the temptations to make changes to the recipe.
Six Ingredients for Fiduciaries
Document Index Performance: Evaluate tracking quality, risk-adjusted returns, and consistency versus a reasonable set of similar index options, over 5-7 years.
Evaluate Fees: Confirm expense ratios are reasonable relative to peer index products and that the plan is in the lowest‑cost share class reasonably accessible, emphasizing net‑of‑fee outcomes rather than fee minimization alone.
Understand Liquidity: Assess the vehicle’s ability to support participant flows and plan‑level events (recordkeeper changes, terminations) without undue friction or trading costs.
Know How the Index is Valued: Confirm that pricing and fair‑value practices are robust, timely, and independent enough for ERISA purposes (e.g., transparent NAV methodology for mutual funds or CITs).
Defined a Meaningful Benchmark: Understand how each fund seeks to replicate or generate market exposure in an asset class or theme.
Test Complexity: Understand any non‑plain‑vanilla index strategy (factor tilts, custom indices, thematic approaches, securities lending) and, if not, enlist the role of an independent adviser to complete this task.
What’s Important for Fiduciaries to Consider: 1) Low-cost, diversified indexing remains a reasonable core holding, 2) Treat benchmark selection as a governed, documented decision, 3) Two similarly named index funds are not necessarily the same product and can produce significantly different outcomes even when the mandate is to cover an asset class, and 4) An active manager’s discipline is only as durable as their ability to remain solvent.
Francis LLC is a Registered Investment Adviser with the SEC. Past performance is no guarantee of future results. Any reference to individual stocks, securities, or companies is not intended as investment advice and could be owned individually or in personal and family portfolios by members of the firm. We have no affiliation with and receive no remuneration from any firm, product, or service provider mentioned in this publication. This paper is for informational and educational purposes only and does not constitute investment, legal, or fiduciary advice; plan fiduciaries should consult qualified counsel and investment professionals before acting on any framework described here.
The exhibits in this paper illustrate the scale of index concentration, how differently providers handled SpaceX’s 2026 listing, the growing gap between market value and fundamentals, and how often discipline has been punished along the way. Exhibits 3 and 4 review the growing gap between index weight and fundamentals, and on how often disciplined active managers have been punished for standing aside.
*Eligibility for SpaceX to be included in an S&P Index in 365 days is contingent on four consecutive quarters of profitability. Financial Time Stock Exchange (London) Russell fast-tracks a new IPO into its indexes after the close of the 5th trading day if the stock’s free-float-adjusted market cap (priced at the first day’s close) exceeds the Russell Top 500 breakpoint, while still requiring the standard 5% free float and 5% voting rights minimums (with a 12-month grace period if lock-up expirations are expected to satisfy them). Center for Research in Security Prices (University of Chicago) screens for U.S. domicile, eligible exchange listing, qualifying security type, float-adjusted market-cap weighting, quarterly reconstitution, and packeting to ensure stocks are investable, tradable, liquid, and classifiable rather than to exclude them outright like S&P’s profitability test.
Sources:
1. S&P 500 top-10 concentration figures (1990, 2000, 2015, 2020, 2025) per Standard & Poor’s.
2. SpaceX IPO details included pricing, valuation, and reported quarterly loss as cited by CNBC and NPR coverage of the June 12, 2026 IPO, and the company’s SEC prospectus.
3. Top-10 weight vs. earnings contribution analysis per RBC Wealth Management, 2015 and 2025 estimates. https://www.rbcwealthmanagement.com/en-uk/insights/the-great-narrowing-sp-500-concentration.
4. Tesla’s S&P 500 inclusion history and profitability requirement per S&P Dow Jones Indices methodology documentation.
5. Active large-cap underperformance rates and fund survivorship statistics per S&P Dow Jones Indices, SPIVA U.S. Scorecard and U.S. Persistence Scorecard, year-end 2025 and year-end 2024 editions.
6. Passive vs. active 2024 fund flow estimates per industry fund-flow reporting cited in coverage of the SPIVA U.S. Scorecard.
7. Advisor technology allocation and sentiment statistics per BlackRock, “AI Stocks, Alternatives, and the New Market Playbook for 2026” and Morningstar Direct data for US Active Fund Large Blend as of July 7, 2026.
